
I mathematically investigate prospects for the remaining delegates game in light of the fact that Hillary Clinton has far more delegates than Bernie Sanders (even more than Barack Obama had over Hillary Clinton at any time in the 2008 primaries) and simulate two scenarios. In both scenarios, I will be conservative in my estimates of Hillary’s delegate share, meaning that I will deliberately use numbers base on the most modest expectations of her margins. Moreover, in Scenario number 2, I calculate Bernie Sanders likely delegate gain in the most optimistic way. Even with these assumptions, I show that Sanders has no rational chance to be the nominee of the Democratic Party in the next presidential election.
After a big victory on March 15, Hillary Clinton widened her lead margin over Bernie Sanders among pledged delegates from 214 to 314 (Figure 1). At the end of the first Super Tuesday on March 1, she had 197 more delegates than Sanders and over the last three weeks Clinton and Sanders added 413 and 530 delegates respectively. As of now, 2,031 delegates have been assigned to either Hillary Clinton or Bernie Sanders; their shares are 56% and 41% respectively.

Due to the proportional delegate allocation for each candidate in the primaries (the rule which has been applied for the all the Democratic primaries) Hillary Clinton needs at least 2,038 delegates to secure her nomination. However, 15% of the all the delegates in the Democratic Party are assigned to the super delegates, among whom Clinton enjoys an overwhelming majority: 467 to Sanders’ 26. Let’s assume that all the remaining super delegates will go for Bernie Sanders: in this case the remaining 221 would combine with his present total to make 247 super delegates in the Sanders column. In this very optimistic scenario, he would enjoy 1,072 delegates (including super delegates) against Clinton’s 1,606. From March 22nd until mid-June, 2,020 more delegates will be at stake. In this scenario, Hillary Clinton needs 777 delegates (38% of the remaining delegates) and Bernie Sanders needs 1,311 delegates (65% of the remaining delegates) to secure the nomination. We’ll now turn our attention to Sanders’ prospects for attaining this magic number.
In the table No.1 (below), I simulate the total number of delegates which could be obtained by each of the candidates in two different scenarios. In both of them, Hillary Clinton will prove to be the nominee.

First, I categorized all the poll numbers in the remaining states based on the average numbers produced by three forecasting websites for both candidates: Five Thirty-Eight, Real Clear Politics and Huffington Post. Because there is insufficient updated information about upcoming primaries, I added one more category (Column 3: State Characteristics) and determined for each candidate the likely outcome of their contest based on actual numbers from states they’ve already won. For example, in the case of Idaho, a state for which reliable polling data is not available, I estimate 40% for Clinton and 60% for Sanders due to the fact that Sanders beat Hillary by this margin in Minnesota, a state demographically comparable to Idaho (e.g. in both states the percentage of non-white voters in 2008 was less than 20% (2015 U.Va. Center for Politics). Nevertheless, in some states such as New York and New Jersey (in which the percentage of non-white voters was 20-35% and 35-50% respectively according to the 2015 U.Va. Center for Politics where current polls favor of Hillary Clinton, I awarded the candidates an equal 50 – 50 share. The main reason for this is that the table is supposed to underestimate Clinton’s prospects and assess her delegate possibilities conservatively. Red numbers in cells indicate values with insufficient information, or situations I consider likely to break even between candidates. I then combined all the numbers and found the average to derive an estimation of the possibility of each candidates’ delegates per state (Column # 5). To give Bernie Sanders a maximally optimistic boost, I multiplied all of Hillary’s averages by 0.9 and all of Bernie’s averages by 1.1 (Columns # 6).
I have a prediction of each candidates’ delegates per state in another two columns. Column A shows the share of the delegates for each candidate (note that even in this column I apportion Hillary’s share in a conservative way). Column B gives a more optimistic view of the possibility of the all the delegates Bernie Sanders could gain until the District of Columbia’s mid-June primary (the party’s final.) According to this analysis Hillary Clinton will enjoy a favorable margin of 1,015 or 913 delegates in the first and second scenarios respectively. In either case she will be well beyond the 777 delegates needed to secure the nomination. Sanders will fail to attain the 1,311 delegates he needs to secure his nomination in both cases.
To better understand how the allocation of delegates for each candidate will play out over the next two months, figure 2 displays each candidate’s possibility of obtaining pledged delegates (plus the difference between the number of delegates for each) in light of Column A’s values (which conservatively assess Hillary’s delegate prospects.) The figure demonstrates that Hillary will handily retain her lead through the end of the race, reaching 421 in Clinton’s favor by the eve of the decisive California primary. However, even before the California primary occurs, Clinton’s margin will be formidable. Note that such numbers do not include super delegates; if we are to factor in the 467 super delegates who are suppose to support Clinton, her lead becomes all the more secure.
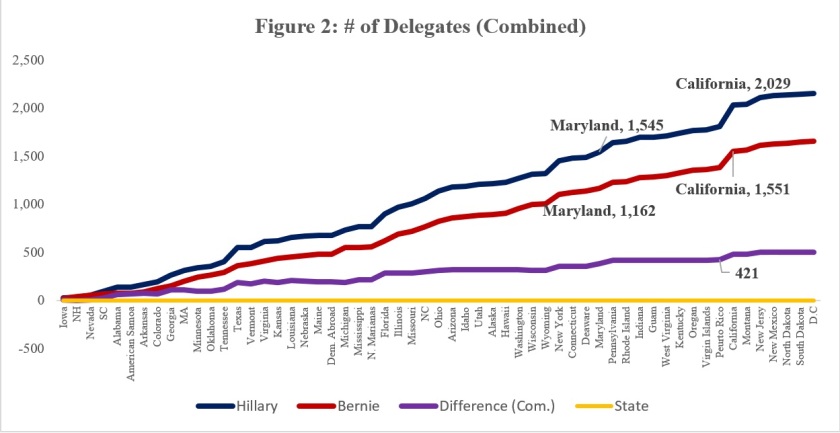
Figure 3 shows the possibility of the candidates obtaining pledged delegates (and the differences between the number of delegates for each) using Column B’s values (which underestimate Clintons prospects against Sanders.) These numbers artificially increase Sanders’ prospects by 10% and decrease Clinton’s take by the same amount.
As is demonstrated in the figure, Hillary will build to a lead of 298 delegates by the eve of the decisive California primary. It is of course less than the present reported difference, with the slope decreasing in a very modest way. Note that such numbers do not include super delegates; if we are to factor in the 467 super delegates who are suppose to support Clinton, her lead becomes all the more secure.

To better understand delegate count differences in each scenario, figures 4 and 5 (radar charts) show Hillary Clinton’s delegate lead margin over time until mid-June. As is clearly demonstrated, Hillary Clinton maintains her lead over time in both scenarios.


This analysis suggests that Hillary Clinton has effectively clinched her nomination for the 2016 presidential election. Although her only remaining rival might well score large delegate wins in the next two months, Clinton’s formidable lead over Bernie Sanders precludes any possibility of his overall victory. The Sanders campaign’s main argument following Super Tuesday 2 has been based on the fact that, as contests shift to the north and west, more than half the remaining electorate strongly prefers Sanders. This argument is both true and false: true because almost all the southern primaries have concluded and some remaining contests in north and west, such as Wisconsin and Washington, stand to benefit Sanders; false because there seems little possibility of Sanders winning remaining delegate-rich states such as New York, Pennsylvania and California by margins wide enough to affect the general outcome. I analyzed delegate prospects for the candidates across two scenarios, both of which were deliberately engineered to favor Sanders (Scenario 2 to a greater extent than Scenario 1) and I foresee no realistic possibility of his upsetting Clinton.
Note: Polls and forecasts conducted following March 17 will not be considered in this analysis. According to most recent polls as of this writing, Hillary Clinton’s position is in fact even stronger than the values I’ve used reflect (take a look at Arizona, here). I will not incorporate updated polls due to the fact that I wanted to optimistically estimate the chance of Bernie’s obtaining the magic 2,382 delegates (including super delegates,) assuming the worst case scenario for Hillary Clinton in order to test the most extreme possible case.
